Six Sigma
The Six Sigma Success Story
Introduced by engineer Bill Smith while working at Motorola in 1986, Six Sigma is a set of techniques and tools for process improvement.
In the 1980s, Total Quality Management (TQM)Opens in new window was popular. It too was an improvement-focused program, but it ultimately died a slow and silent death in many companies.
What makes Six Sigma different?
Three key characteristic separate Six Sigma from quality programs of the past.
- Six Sigma is customer focused.
It’s almost an obsession to keep external customer needs in plain sight, driving the improvement effort. (External customers are mostly those who buy your business’s products and services.)
- Six Sigma projects produce major returns on investment.
At GEOpens in new window, for example, the Six Sigma program resulted in the following cost versus returns:
- In 1996, costs of $200 million and returns of $150 million
- In 1997, costs of $400 million and returns of $600 million
- In 1998, costs of $400 million and returns of more than $1 billion
GE’s CEO, Jack WelchOpens in new window, wrote in the annual report that in just three years, Six Sigma had saved the company more than $2 billion.
We didn’t invent Six Sigma—we learned it. The cumulative impact on the company’s numbers is not anecdotal, nor a product of charts. It is the product of 276,000 people executing and delivering the result of Six Sigma to our bottom line. — Jack Welch in 1997
- Six Sigma changes how management operates.
Six Sigma is much more than improvement projects. Senior executives and leaders throughout a business are learning the tools and concepts of Six Sigma: new approaches to thinking, planning, and executing to achieve results. In a lot of ways, Six Sigma is about putting into practice the notions of working smarter, not harder.
As we’ve seen, Six Sigma has produced some impressive numbers. But reaching them requires a great deal of organizational teamwork. It means having the systems to provide customers what they want when they want it. It means providing employees with the time and training to tackle work challenges with some basic, and some sophisticated, analytical tools.
Characteristically Defining Six Sigma
Understanding Six Sigma does not require any great skill or background in statistics. In fact, “What is Six Sigma” can be answered in various ways. In this section, we’ll concentrate on defining Six Sigma as:
- A statistical measure of the performance of a process or a product
- A goal that reaches near perfection for performance improvement
- A system of management to achieve lasting business leadership and world-class performance
In exploring these definitions, we’ll provide some insights into why Six Sigma is such a powerful movement.
Six Sigma as a Statistical Measure
The word “sigma” is not what we come across quite often. Until recently, the term has not been used much in ordinary conversation. The lowercase Greek letter sigma—σ—stands for standard deviation. Standard deviationOpens in new window is a statistical way to describe how much variation exists in a set of data, a group of items, or a process.
For example, if you weigh potato chips of many different sizes, you’ll get a higher standard deviation than if you weigh potato chips of all the same size.
As another example, suppose that you run a business that delivers pizzas to nearby offices. You make pretty good pizzas and have lots of customers.
According to your contract with your customers, pizzas will be delivered fresh and hot between 11:45 a.m. and 12:15 p.m. This allows customers to get their orders in time for lunch (their “requirement”).
You have also agreed that if a pizza is delivered before 11:45 or after 12:15 (a “defect”), you will discount their next order by 50 percent. Because you and your staff people get a bonus for on-time delivery, you are all very motivated to deliver the pizzas during the half-hour window the customers want.
Here’s how Six Sigma, as a measure, could play a part in this simple process:
- If you deliver only about 68 percent of your pizzas on time, your process is at only a “2 sigma” level.
- If you deliver 93 percent on time, which sounds good, you are operating at only a “3 sigma” level of performance.
- If you get 99.4 percent of them there on time, you’re operating at “4 sigma.”
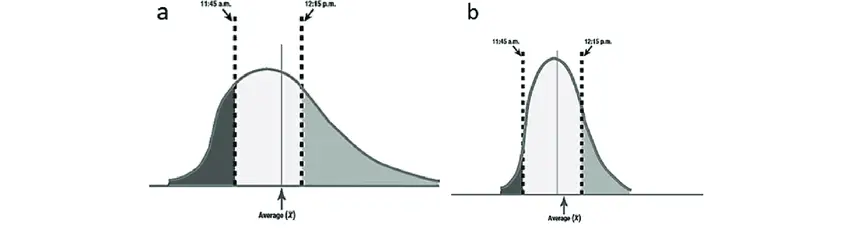
| Figure X-1. |
|---|
|
To be a Six Sigma pizza shop, you would have to have on-time pizza delivery 99.9997 percent of the time! That’s practically perfect. In fact, for every million pizzas you make (a lotta mozzarella), you’d end up with only three or four late deliveries. Nice going! (See Figure X-1.)
Keep in mind that the sigma measure is looking at how well you’re meeting customer requirements. If your customers require their pizzas in a 10-minute window, from 11:55 a.m. to 12:05 p.m., your sigma level would almost certainly get worse.
The sigma measure was developed to help:
- Focus measures on the paying customers of a business. Many of the measures, such as labor hours, costs, and sales volume, companies have traditionally used to evaluate things that are not related to what the customer really cares about.
- Provide a consistent way to measure and to compare different processes. Using the sigma scale, we could assess and compare performance of, say, the pizza baking process with the pizza delivery process—two very different but critical activities.
The first step in calculating sigma or in understanding its significance is to grasp what your customers expect. In the language of Six Sigma, customer requirements and expectations are called CTQs (critical to quality).
In the pizza example, one of the key customer requirements is timely delivery. Other requirements are likely to be related to the temperature of the pizza, the accuracy of the order, tastiness, and so on. In fact, one of the keys of Six Sigma is to better understand and assess how well a process performs on all CTQs, not just one or two.
We use the sigma measure to see how well or poorly a process performs and to give everyone a common way to express that measure. Table X-1 summarizes the levels of sigma performance by how many defects would occur for every million opportunities or activities.
| Table X-1 | |
|---|---|
| SIGMA LEVEL | DEFECTS PER MILLION OPPORTUNITIES |
| 6 | 3.4 |
| 5 | 233 |
| 4 | 6,210 |
| 3 | 66,807 |
| 2 | 308,537 |
| 1 | 690,000 |
(Even if it would take a long time for your process to do a million items or tasks, don’t worry; this scale is just a projection of the number that would happen if you did!)
Six Sigma as a Goal
When a business violates important customer requirements, it is generating defects, complaints, and cost. The greater the number of defects that occur, the greater the cost of correcting them, as well as the risk of losing the customers. Ideally, your company wants to avoid any defects and the resulting cost in money and customer satisfaction.
But if you have lots of customers, some defects are bound to slip through, right? The problem is that even a seemingly low percentage of defects can mean a lot of unhappy customers. If your company processed 250,000 credit card bills a month and operated at 99.38 percent accuracy (4 sigma), you’d have about 1,550 unhappy customers every month. (How would you like to call them all and apologize?)
Remember, accuracy is just one requirement. If delivering the bills on time is another key factor and you’re at the same level of performance (99.38 percent, or 4 sigma), you’d have yet another 1,550 defects (late bills) each month. So although 99.38 percent quality in credit bills sound good, it’s not so good for the customers (3,000 a month or more, in this case) who get hit with defects.
The goal of Six Sigma is to help people and processes aim high in aspiring to deliver defect-free products and services. The notion of zero defects is not at work here; Six Sigma recognizes that there’s always some potential for defects, even in the best-run processes or best-built product. But at 99.9997 percent performance, Six Sigma sets a performance target where defects in many processes and products are almost nonexistent.
See Also:
- Research data for this work have been adapted from the manuals:
- Schroeder, R. G., Linderman, K., Liedtke, C., & Choo, A. S. (2008). Six Sigma: Definition and underlying theory. Journal of Operations Management, 26, 536 – 554.
- Lucas, J. M. (2002, January). The essential Six-Sigma. Quality Progress,
- Snee, R. D. (2004). Six Sigma: The evolution of a 100 years of business improvement methodology. International Journal of Six Sigma and Competitive Advantage, 1(1), 4 – 20.
- Sheehy, P., Navarro, D., Silvers, R., Keyes, V., & Dixon, D. (2002). The black belt memory jogger. Salem: Goal/QPC and Six Sigma Academy.
- Tannock, J. D. T., Balogun, O., & Hawisa, H. (2007). A variation management system supporting Six Sigma. Journal of Manufacturing Technology Management, 18 (5), 561 – 575.
- Haikonen, A., Savolainen, T., & Jarvinen, P. (2004). Exploring Six Sigma CI capability development: Preliminary case study findings on management role. Journal of Manufacturing Technology Management, 15 (4), 369 – 378.
- Motwani, J., Kumar, A., & Antony, J. (2004). A business process change framework for examining the implementation of Six Sigma: A case study of Dow Chemicals. The TQM Magazine, 16 (4), 273 – 283.
- Maleyeff, J., & Kaminsky, F. C. (2002). Six Sigma and introductory statistics education. Education + Training, 44 (2), 82 – 89.